

HVAC Thermal Comfort and Air Distribution Analysis in Compliance with ASHRAE 55
This case study presents a computational fluid dynamics (CFD) assessment of indoor air distribution and thermal comfort performance for a commercial office environment. The objective was to evaluate airflow uniformity, temperature stratification, draft risk, and occupant comfort parameters in accordance with ASHRAE Standard 55.
COMPUTATIONAL FLUID DYNAMICS
Case Study: HVAC Thermal Comfort and Air Distribution Analysis
Project Overview
Thermal comfort and effective indoor air distribution are critical to occupant well-being and energy-efficient HVAC design in commercial buildings. This case study presents a Computational Fluid Dynamics (CFD) investigation of a conditioned office space to evaluate airflow patterns, temperature distribution, and thermal comfort parameters in accordance with ASHRAE Standard 55 – Thermal Environmental Conditions for Human Occupancy. The analysis identifies discomfort zones, assesses compliance with comfort criteria, and provides design optimization insights prior to implementation.
Objectives of the Study
The primary objectives of this CFD analysis were to:
Assess indoor airflow distribution and temperature uniformity
Evaluate draft risk and comfort/discomfort zone occurrence
Quantify thermal comfort parameters using ASHRAE 55 criteria (PMV & PPD)
Identify opportunities for HVAC diffuser configuration optimization
Provide engineering recommendations to improve comfort and energy performance
System Description
Following parameters were provided by the client to conduct this Building HVAC simulation
Floor Area (multiple floor model)
Ceiling Height
HVAC: Centralized cooling system with multiple ceiling diffusers
Occupancy
Internal Gains: Lighting and equipment loads
Outdoor Design Condition: Summer cooling scenario
CFD provides spatial resolution of indoor airflow and temperature fields, enabling detailed comfort assessment beyond conventional load-based HVAC design.
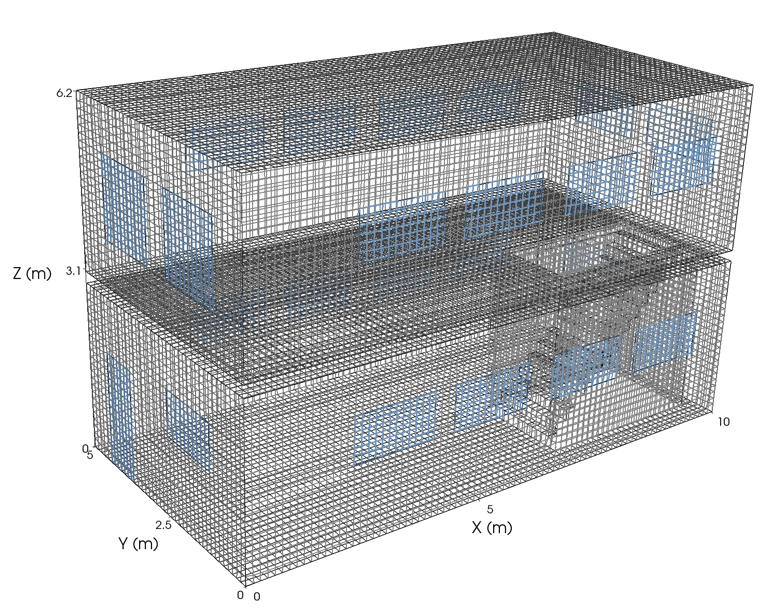
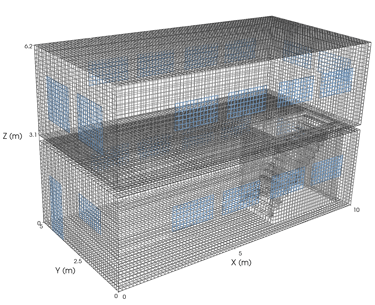
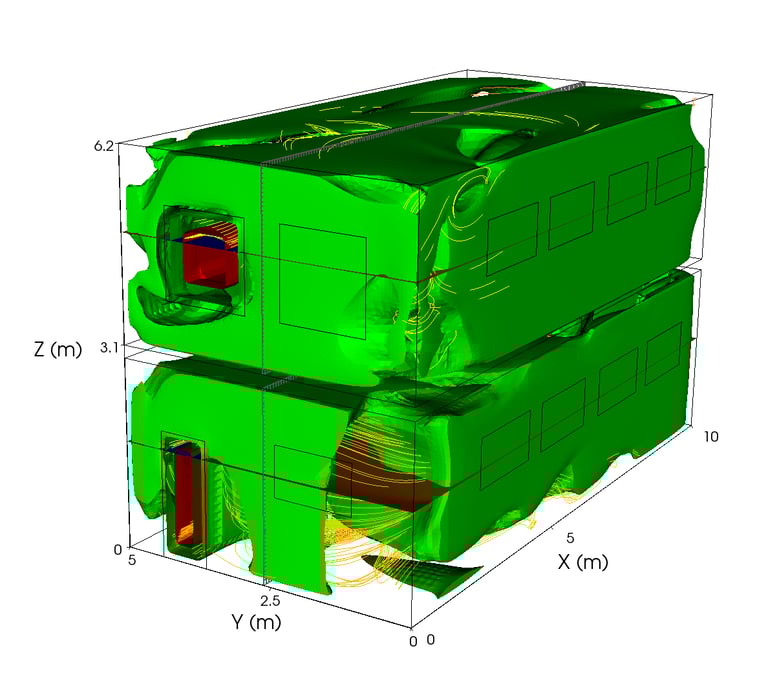
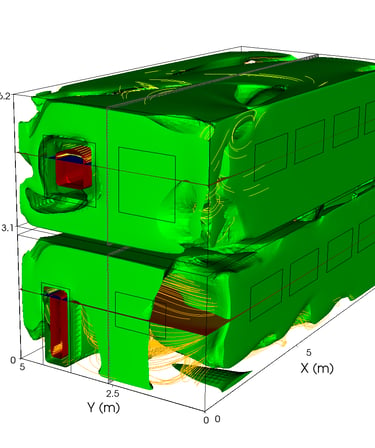
Geometry and Computational Domain
The 3D computational domain includes:
Full representation of the office space with walls, floor, ceiling
Inlet supply diffusers
Return grilles
Occupied zone (0.1 – 1.8 m above floor) refinement for comfort evaluation
Mesh was generated with local refinement in the occupied zone and near diffusers to ensure accurate velocity and temperature prediction.
Boundary Conditions
Natural Circulation
For the open windows (depending upon scenarios), natural circulation boundary conditions were applied
Velocity Inlet
Majorly at the diffusers
Walls
No-slip velocity condition
Adiabatic or specified heat transfer conditions depending on insulation
Governing Equations:
The indoor airflow was simulated using the Reynolds-Averaged Navier–Stokes (RANS) equations coupled with the energy equation to capture thermal effects. The CFD solver employed:
BuoyantBoussinesqSimpleFoam solver
k–ε turbulence model for Reynolds stresses
Steady-state solution approach
Convergence monitored for continuity, momentum, and thermal residuals
Comfort Assessment Methodology
Comfort evaluation combined the internal comfort/discomfort zone mapping with external post-processing according to ASHRAE Standard 55:
Key Comfort Criteria
Air velocity (draft) limits: < 0.25 m/s in the occupied zone
Vertical temperature stratification: < 3 °C between ankle and head heights
PMV (Predicted Mean Vote): Target range −0.5 to +0.5
PPD (Predicted Percentage Dissatisfied): Target < 10%
BlueCFD-AIR’s internal comfort zone flags were based on temperature and velocity thresholds; detailed human comfort indices (PMV/PPD) were computed externally using extracted field data and Fanger’s thermal comfort model per ASHRAE 55.
Post-Processing and Key Results
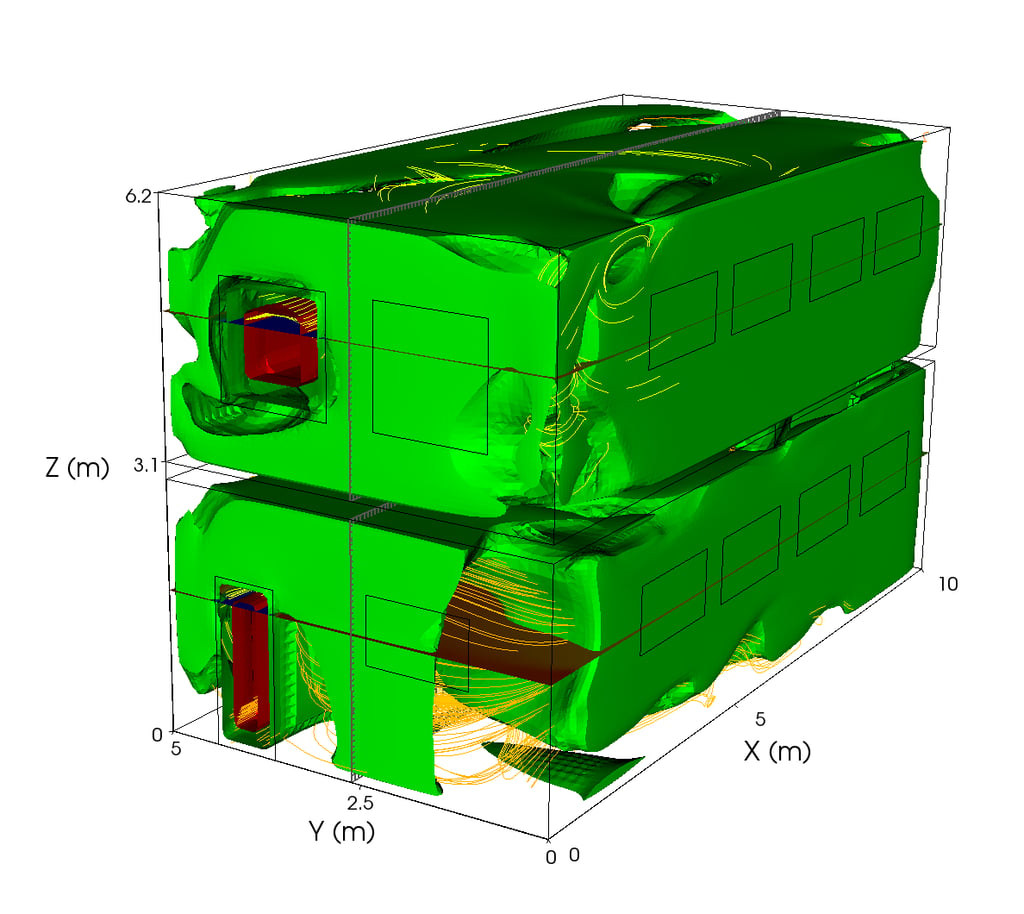
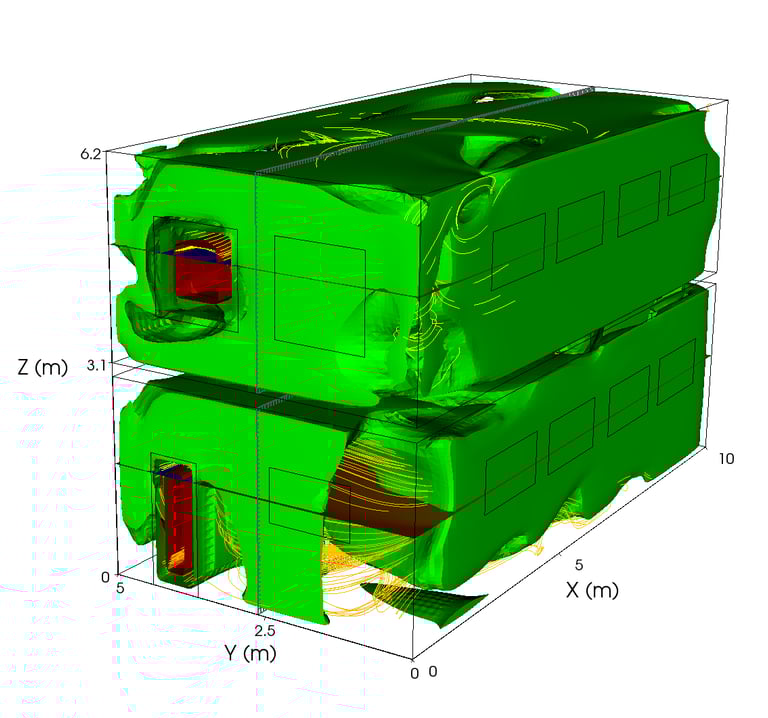
Flow Distribution
Air velocity distribution showed good mixing throughout the occupied zone.
Average air velocity: ~0.18 m/s.
No significant draft risk was observed within the occupant breathing level.
Comfort zone mapping indicated limited discomfort regions near diffusers before optimization.
Temperature Distribution
Temperature was uniformly distributed with an average of ~23.6 °C in the occupied zone.
Vertical temperature difference between ankle and head level was less than 1.8 °C, satisfying ASHRAE 55 criteria.
Thermal Comfort Metrics
Using CFD-extracted air temperature (Ta), mean radiant temperature (Tr), relative humidity, and air velocity, PMV and PPD were computed based on Fanger’s model:
PMV: +0.11
PPD: 5.9%
These results fall within the allowable comfort limits specified in ASHRAE 55, indicating a thermally acceptable environment.
Design Optimization and Engineering Insights
Initial simulation showed localized draft and elevated temperature near specific workstations. Design modifications included:
Adjusting diffuser orientation (angled flow toward center of space)
Reducing supply velocity by ~8%
Rebalancing return grille location
Benefits to Industry
CFD-based HVAC performance analysis provides significant value across commercial and industrial sectors:
✔ Improved Occupant Comfort
Ensures uniform temperature and eliminates draft discomfort.
✔ Reduced Energy Consumption
Prevents overcooling and excessive airflow rates, improving system efficiency.
✔ Optimized HVAC Layout
Supports evidence-based diffuser and return grille placement.
✔ Reduced Post-Installation Modifications
Minimizes costly field adjustments and occupant complaints.
✔ Improved Indoor Air Quality
Ensures effective ventilation and contaminant dilution.
✔ Risk Reduction in Sensitive Environments
Supports data centers, laboratories, and healthcare facilities requiring precise airflow control.
Industrial Applications
Commercial Office Buildings
Open-plan offices
Corporate headquarters
Co-working spaces
CFD ensures uniform air distribution, eliminates draft complaints, and validates comfort before commissioning.
Manufacturing & Industrial Facilities
Assembly halls
Production floors
Tooling and machining areas
Large-volume industrial spaces often suffer from stratification and poor mixing. CFD helps optimize supply air distribution and improve ventilation efficiency while controlling operational costs.
Pharmaceutical & Cleanroom Environments
ISO-class cleanrooms
Controlled manufacturing areas
Sterile packaging units
CFD enables airflow pattern validation, contaminant transport analysis, and confirmation of uniform environmental conditions critical for regulatory compliance.
Healthcare Facilities
Operating rooms
Isolation wards
Laboratories
Air distribution validation helps maintain controlled environments, reduce infection risks, and improve ventilation effectiveness in sensitive spaces.
Data Centers & Server Rooms
Precision cooling applications
Hot aisle–cold aisle containment
CFD identifies hot spots, optimizes airflow routing, and reduces energy consumption by preventing overcooling.
Educational & Public Buildings
Classrooms
Auditoriums
Shopping malls
Improved air circulation enhances occupant comfort and indoor air quality in high-density environments.
Author Linkedin Profile
+91-9879488468
© 2025. All rights reserved.